The Statistics function is a collection of context calculations that expose classic statistics on metrics used in the current query. The statistics include average (mean), median, standard deviation and quartiles. The process involves generating a context custom column formula on the chosen metric and then auto-adding the new statistic to the existing visualization. In this way, it's possible to see statistical values on any visual and use them in multiple contexts.
Note: Advanced Analytical functions may not be available in your user profile.
Using the Statistics Function
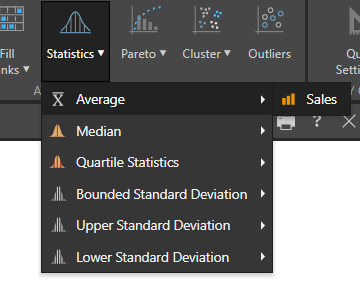
To use the Statistics function, open the Statistics dropdown list from the Query ribbon and pick one of the statistical calculations:
Each of the values or measures in the current query are presented in the dropdown list.
Statistics Options
- Average: The statistical average of the values in the query.
- Median: The statistical median of the values in the query.
- Quartile Statistics: The quartile interval of the values in the query.
- Bounded Standard Deviation: Returns the requested standard deviation values both above and below the mean.
- Upper Standard Deviation: Returns the requested standard deviation value above the mean.
- Lower Standard Deviation: Returns the requested standard deviation value below the mean.
Note: Quartile Statistics are not supported by Tabular and OLAP data sources, and will not be displayed.
Select one of the value measures to generate a new value chip that applies the statistical function to that metric in the context of your query and auto-adds it to the drop zones for visualization.
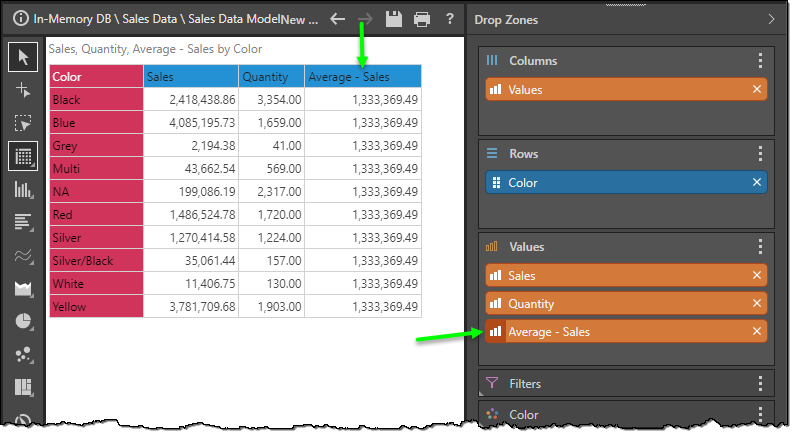
Once you have that chip, you are free to move it to any other drop zone like all other metrics in your data model.,
Removing Statistical Values
To exclude statistical logic from your query simply remove the orange value chip from the relevant drop zone.
Context Menu driven Statistics
Instead of using the ribbon statistics tool, you can also use the context calculation menus to build statistics on a given value (measure) chip. See here for more information.
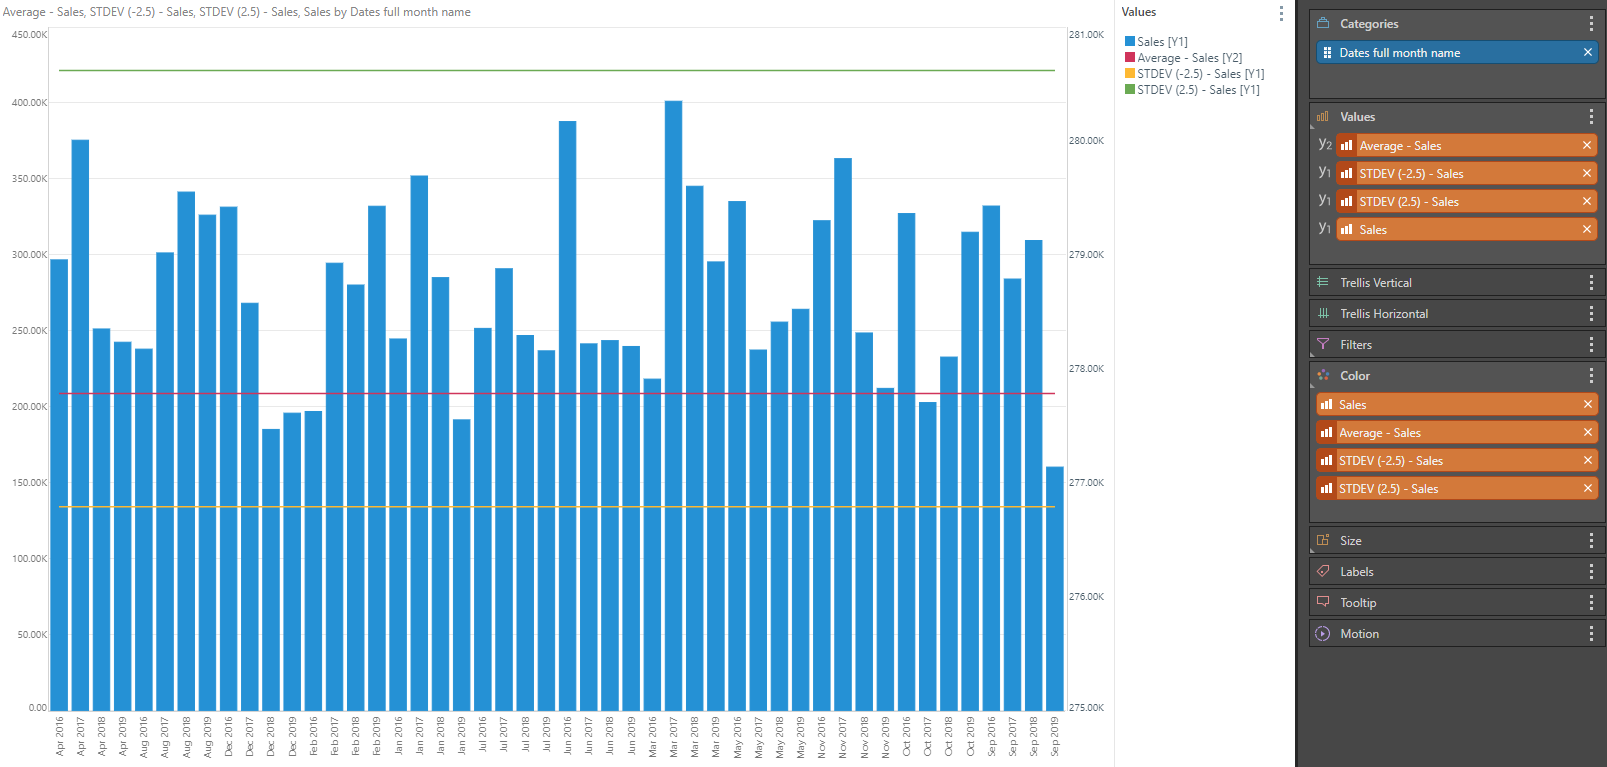
Example
In the chart below, we have chosen to show average sales and standard deviation of sales on a bar chart using primary and secondary axes.